There is more history percolating up in the current Iranian madness than just another failed Forever War. It’s going to be the end of the Trumpified GOP too, and that means that a motley menagerie of Dem statists, spenders, regulators, lifers, wokests and outright freaks are likely to be swept back into power in the elections just ahead. Sadly, that will likely mark the end of capitalist prosperity and constitutional liberty in America as we have known it, too.
The truth is, only the old time GOP committed to free markets, fiscal rectitude, sound money, small, decentralized government and non-intervention abroad had any chance at all of reversing the 20th century tide of insolvent, inflationary, debt-encumbered Big Government. But that GOP of yesteryear was already deader than a doornail after three terms of the Bush’s spending, bailouts and money-printing – even before the Trumpified GOP delivered the coup de grace. That is, by going full retard on spending, borrowing, money-printing, protectionism, nativism and random government regulation and subsidization on the specious grounds of “national security”.
On another occasion we will get into a fuller amplification of all the manifold statist sins of the now thoroughly Trumpified GOP. But in the meanwhile, it might be well to recognize that Donald Trump unaccountably rode into office a second time against all reason because, and only because, AFFORDABILITY!
But now his epic idiocy in starting the largest war since Vietnam in the Persian Gulf is virtually guaranteed to come back to bit him hard upon his ample ass. In fact, setting aside all his bloviating in the SOTU about smashing inflation and igniting a new golden era of prosperity, the picture below is what really matters.
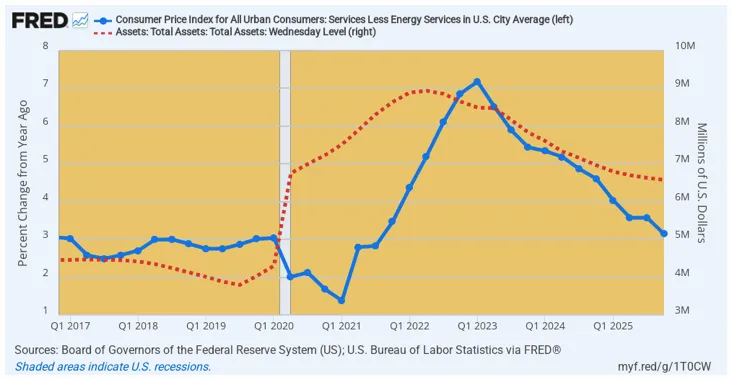
To wit, the Fed generated the 40-year high US inflation when it flooded the bond pits with fiat credit during the pandemic lockdown panic in the spring of 2020. We measure the effect via the BLS index of domestic services less energy because it removes any fog in the picture owing to global commodity and manufacturing cycles that may impact timing of inflation numbers, albeit not the ultimate destination of the price level.
Needless to say, it doesn’t get any more dispositive than this graph. Prior to the pandemic driven money explosion beginning in March 2020, the Y/Y increase rate for all domestic service prices other than energy services had been plunking along at +3.0% per annum, reflecting the trend level of inflationary bias in the US economy owing to the Fed’s egregious and persistent credit expansion.
But after three quarters of weakening inflation during the period from Q2 2020 to Q1 2021 – when the Donald ordered people to board up in their homes and made it illegal to spend money at service establishments such as restaurants, bars, movies, malls, sports arenas, theme parks etc – the blue line tracking the domestic services index took-off like a bat out of hell after Q1 2021.
And, yes, don’t fail to recall that Uncle Milton Friedman told us there were brief and not totally fixed time lags between bad money and rising prices. Still, the picture below is nearly picture perfect.
Between Q4 2020 and Q4 2021, the Fed’s balance sheet (dotted red line) exploded from $4 trillion to $9 trillion, thereby representing a rate and magnitude of increase never seen or even imagined by pedigreed inflationists before then.
So three or four quarters later the blue line for domestic services followed the money flood like clockwork. Accordingly, the Y/Y rate of advance escalated from the 2%-3% trend line to 7.2% by Q1 2023.
Thereafter, of course, the Fed pivoted to restraint, shrinking its balance sheet via QT (quantitative tightening or letting its bond portfolio roll-off as holdings get redeemed at maturity) from just under $9 trillion in Q1 2022 to $6.58 trillion by Q4 2025.
Again, with a modest lag, the Fed’s pivot to restraint has caused the inflationary momentum of the domestic economy to abate, with our key measure of domestic inflation most directly impacted by the central bank – domestic services less energy services – dropping from +7.19% on a Y/Y basis at the 2023 peak to less than half that level, but a still robust +3.14% in Q4 2025.
Fed Balance Sheet Versus Y/Y Change In Domestic Services CPI, Q1 2017 to Q4 2025
Now here’s the thing. Donald Trump didn’t have a damn thing to do with the downhill march of the blue line in the graph above. The rate of increase in domestic services prices was already down to 4.1% Y/Y by Q1 2025 owing to the Fed’s pivot to restraint, and, if anything might have marched to lower than the aforementioned 3.14% by Q4 2025 had the Donald not been riding the Fed so hard to deepen its rate cuts.
As it is, however, the above depicted progress on the inflation front may be all she wrote. The Fed’s balance sheet actually bottomed in December 2024 at $6.35 trillion and is now on the rise again owing to the latest money-printing gambit from Powell and his merry band called the “ample reserve regime”. The latter, of course, is a made from whole-cloth excuse for running the printing presses when, self-evidently, the Fed has printed enough fiat credit since 2008 to suffice for decades to come.
In fact, had the Fed even followed Milton Friedman 3% growth rule after Greenspan took over in August 1987, its balance sheet today would stand at just $750 billion. That means, in turn, that it is still sitting on upwards of $6 trillion of inflationary firepower.
So the Donald’s “give me” from the Fed is about to end, and that’s were the rubber of his insane attack on Iran is going to meet the road of re-accelerating inflation readings and the Dems going on the 2026 election warpath on the affordability issue.
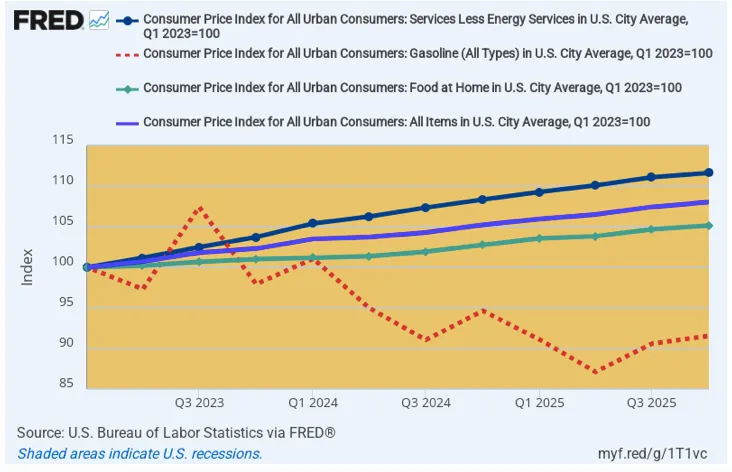
This chart tells you why. Since services inflation peaked in Q1 2023, the decline in headline CPI has been driven overwhelmingly by the collapse of global oil prices and gas pump prices especially. To wit, the headline CPI figure is still up at a +2.84% per annum rate, but even that is due to a negative -3.18% inflation rate for gasoline and +1.83% rate for groceries.
By contrast, the part of the CPI that the Fed can impact most directly in the short-run is the above displayed CPI for services (shelter, medical care, education, household and business services etc.). Yet despite its cooling from the peak rate of 7.1% in Q1 2023, the annualized increase since then has still posted at +4.07% per annum and is now heading higher as the Fed’s printing press begins to again spill excess fiat credit into the financial system.
Annualized Inflation Rate Since Q1 2023:
- Gasoline: -3.18%.
- Groceries: +1.83%.
- Headline CPI: +2.84%.
- Domestic Services: +4.07%
Index of Headline CPI, Services CPI, Groceries CPI And Gasoline CPI since Q1 2023
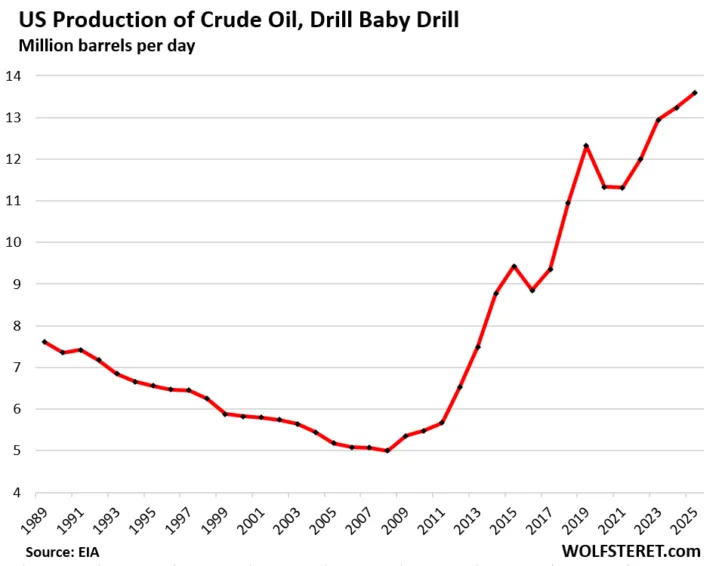
In this context, it appears that the Donald and his MAGA men believe that their “drill baby, drill” mantra will shield the GOP from a rising headline inflation rate and “affordability” backlash at the polls next November. Yet they could not be more completely and fatally wrong. That’s because the price at the pump in Podunk Iowa is set by the supply and demand balance in the global crude oil and product markets, not by domestic production levels.
But as we will amplify in detail in Part 2, any further modest gains in domestic production would not even begin to off-set the large shortfalls that are virtually certain to materialize in the 103 million barrel per day global petroleum market, as the Persian Gulf goes up in flames under the bombs and missiles that will be flying from both sides for weeks and weeks yet to come.
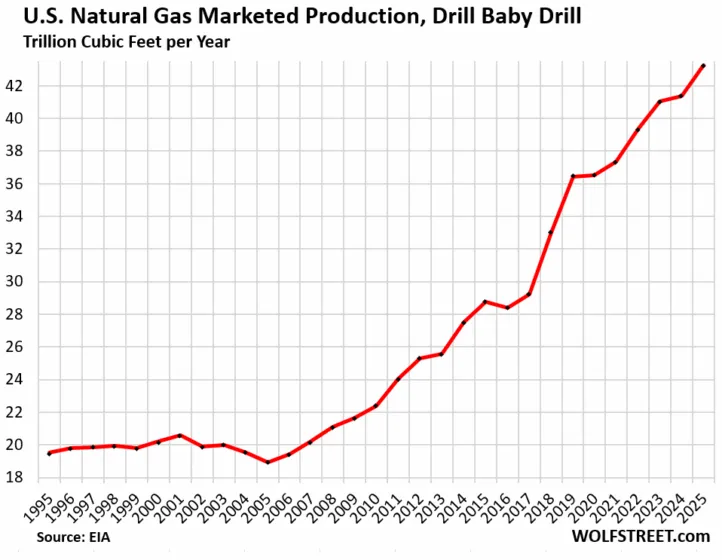
In any event, drill, baby drill has caused domestic production of both crude oil and natural gas to soar since the production bottom was reached in 2007-2009 period. But as we will show in Part 2, global and domestic petroleum prices have not remotely tracked the production paths shown below. Any further crude oil production increases from the current 13.5 million barrels per day might amount to a few hundred thousand b/d at best. And that would be a drop in the bucket of the global 103 million barrels per day market, which stands to loose a substantial fraction of the 20 mb/d that transits thru the Strait of Hormuz and especially out of the Iranian energy fields.
David Stockman was a two-term Congressman from Michigan. He was also the Director of the Office of Management and Budget under President Ronald Reagan. After leaving the White House, Stockman had a 20-year career on Wall Street. He’s the author of three books, The Triumph of Politics: Why the Reagan Revolution Failed, The Great Deformation: The Corruption of Capitalism in America, TRUMPED! A Nation on the Brink of Ruin… And How to Bring It Back, and the recently released Great Money Bubble: Protect Yourself From The Coming Inflation Storm. He also is founder of David Stockman’s Contra Corner and David Stockman’s Bubble Finance Trader.