If the Donald does not wish to bring down upon himself the ignominy of being the first US president to be impeached, convicted and removed from the White House by the US Marshals, he damn well better start reading the Iranian settlement proposals.
Even if he doesn’t like the first sentence, as he boasted.
I looked at it, and I don’t like the first sentence. I just throw it away.
That’s because he doesn’t have “all the time in the world” to find an off-ramp from his Iranian War disaster, as he claims. In fact, the dual blockade he has triggered in the Persian Gulf is fast draining the world’s working stockpiles of a broad array of commodities. About 30 million BOE/day (barrels of oil equivalent) is ordinarily generated inside the Persian Gulf and exported to the global economy, including petroleum in all its product variants, LNG, LPGs, sulfur, helium, aluminum and more.
In the case of petroleum products alone, the stockpile drain is now turning into a torrent, as we reach the 76th day in which normal Persian Gulf export volumes have been reduced by 90% or more. And although the current inventory balances look big because stockpiles are measured in the billions of barrels, the picture is deteriorating far faster than its appears to be on the surface.
In the first place at the onset of Bibi & Trumpy’s foolish war on Iran, global commercial stocks of crude and products combined were unusually high at about 8.5 billion barrels, owing to a modest surplus of production versus consumption during the last two years.
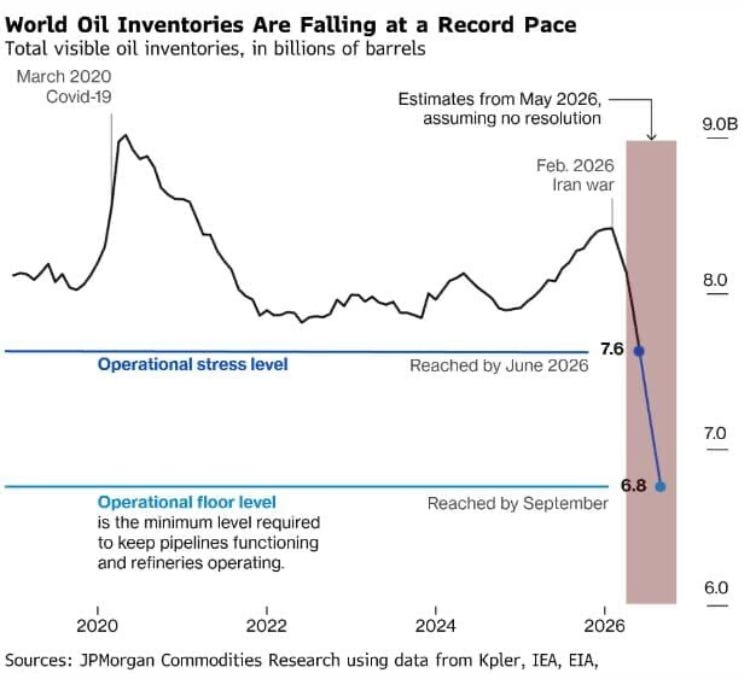
However, it should also be noted that the true recent baseline for global commercial petroleum stocks is a fair amount lower or about +/- 8 billion barrels per the graph above. So there was an extraordinary cushion of about 500 million barrels at the start of the war, but that’s already long gone.
Moreover, the aberrantly high levels shown for Q1 2020 (9 billion barrels +) doesn’t really provide any useful benchmark because that was strictly due to pandemic-based worldwide shutdowns of normal economic activity in consumption sectors ranging from cancelled global airline flights, to reduced trucking and rail mileage, to domestic travel and commuter-based curtailment of gasoline use.
Secondly, when you look at the normal global commercial stocks of about 8.0 billion barrels from the bottom up, it quickly becomes apparent that most of these barrels are spoken for and are not available as inventory cushion to prolong the Donald’s apparent waiting game. For instance, there is normally about 1.0 billion barrels in transit on the blue water in tankers, but those barrels are not some kind of floating surplus; they are actually the product of physics and current shipping technology.
To wit, it takes between 20 and 40 days for most global waterborne transit to get to Japan, China, Taiwan, Korea or Rotterdam or the US Gulf coast from the Persian Gulf, among dozens of other in-take points. Over any reasonable period of time, the the VLCCs which transport most of the global waterborne inventory are not going to get any bigger or travel any faster.
So this amounts to what is known as “pipeline fill” in the trade, but is only the most obvious case of a multitude of storage and transit points between the oilfields of the Persian Gulf and end markets. You have the same thing, with overland pipelines throughout the US, Europe, Russia, China and places in-between, where there are tens of millions of barrels always moving through system.
Next, there are massive tank farms at refinery and upstream distribution points. Likewise, hundreds of millions of barrels at any moment in time are moving through petroleum product pipelines, rail tankers, trucking tankers and other channels of distribution downstream of refineries.
And yet that’s not the whole of it. As you move closer to retail and end users there are more refined product tank farms, hundreds of thousands of gasoline and diesel fuel stations with their own storage tanks, and finally hundreds of millions of auto, tractors, trucks, locomotives and aircraft, which carry their own rolling inventories
Just in the case of the the light vehicle fleet in the USA, there are 285 million vehicles on the roads, which carry about 2.42 billion gallons of fuel at any point in time. That’s another 58 million barrels in the working inventory of the system.
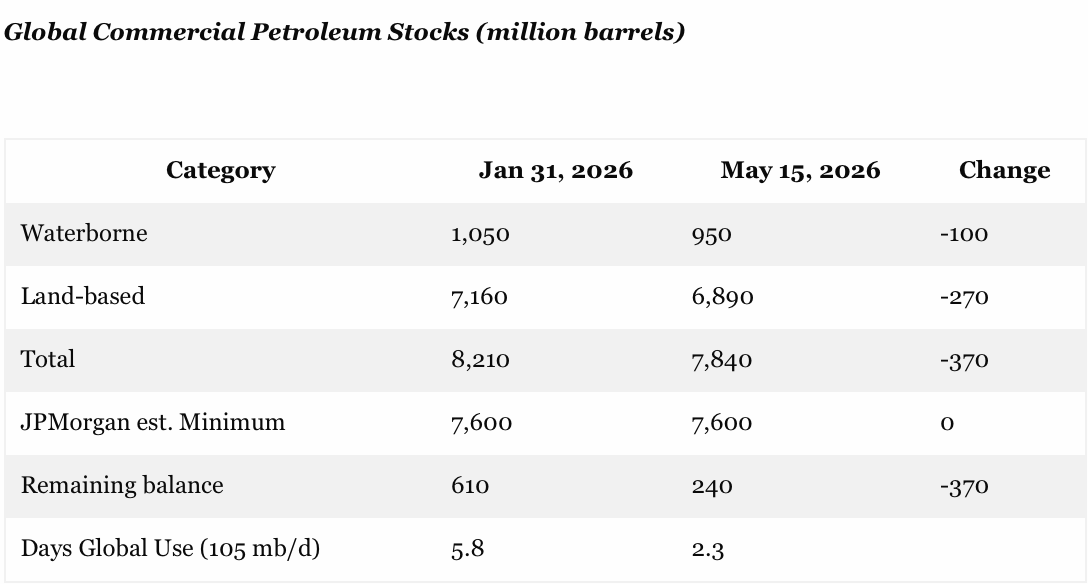
In any event, JPMorgan estimates that this normal “pipeline fill” or working inventory amounts to about 6.8 billion barrels on a worldwide basis. So even though the global commercial stocks totaled about 8.21 billion barrels on the eve of the war on January 31, upwards of 83% of that represented working inventories rather than a usable supply cushion.
Thus, as shown in the table below, the true usable surplus in the global petroleum inventory was about 610 million barrels as if January 31st, which represented just 5.8 days of ordinary global consumption of about 105 million barrels per day. Moreover, due to stockpile depletion since then as of May 15, the waterborne stock is down by-100 million barrels and land-based stock by -270 million barrels.
Overall, 370 million barrels or 60% of the true pre-war surplus has already been used up. So the current 240 million barrel excess above the JPMorgan estimated minimum working inventory amounts to just 2.3 days of normal global consumption.
When the system drops below the 7.6 billion working inventory minimum level, random disruptions begin to erupt unpredictably. For instance, refineries use a variety of different grades of crude oil, and if a certain blend-stock comes in short, refinery output and downstream availability can be sharply curtailed. Likewise, refinery product slates are extremely complex ranging from LPGs to jet fuel, gasoline, several distillate blends, heavy oils, asphalt and much more in-between.
When these output become unbalanced in the distribution system, more compounding outages and shortages develop. And that’s to say nothing at all about the true Big Enchilada of this massive, complex and delicate supply chain. To wit, the 7.6 billion barrel working inventory estimated by JPMorgan represents normal, steady-state, non-disrupted conditions.
But when shortages or outages develop or even fears of them proliferate, operators up and down the petroleum supply chain begin to build up precautionary stocks. This is, what was known as”topping the tank” during the supply disruptions of the 1970s. It amounts to rational hoarding behavior in the face of a stressed supply chain.
For instance, just adding 7 gallons to the normal auto tank in the USA alone, as happened in the 1970s, would drain upwards of 50 million barrels of inventory from the supply chain upstream of the gas pumps.
In all, therefore, the global inventory system is very close to the edge of a hoarding breakout. That is, at the point where there is very little true surplus cushion left in the global inventory system and hoarding based supply disruptions begin dramatically disrupt and roil the system.
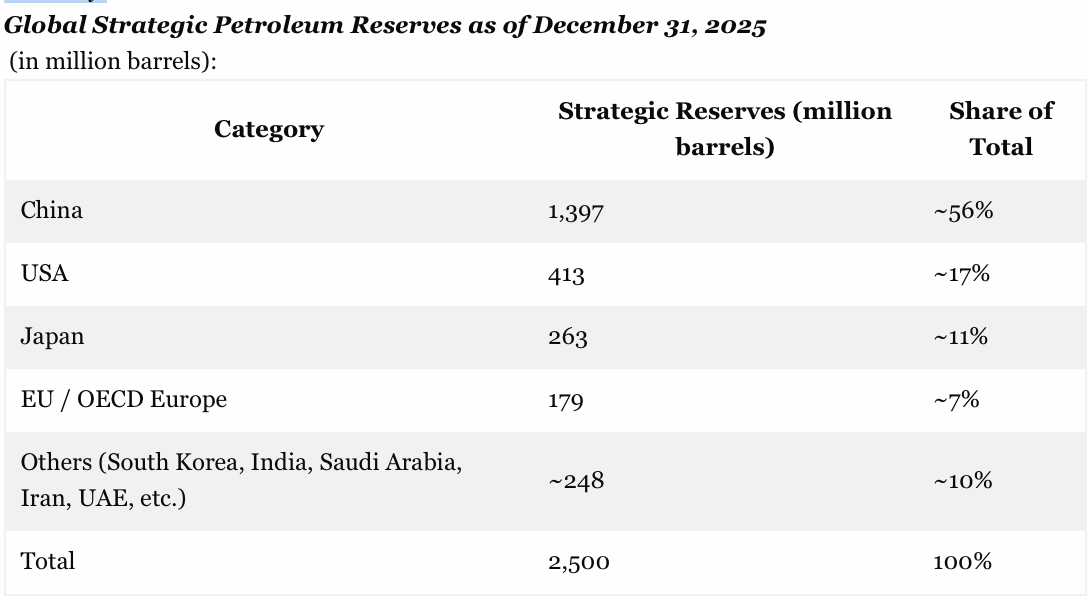
To be sure, there is another 2.5 billion barrels of so called strategic or govenrment managed “emergency” stockpiles, but these numbers aren’t nearly what they are cracked up to be, either. As shown below, 55% of the total is held by China, which may or may not release it into world markets based on what suits the convenience and purposes of the rulers in Beijing.
Notably, Trump didn’t even raise the issue during his visit—notwithstanding the fact that Chairman Xi sits on 50% of all the available surplus on the planet (2.5 billion of strategic reserve stocks plus the above calculated 240 million barrels of remaining excess commercial stocks). Likewise, Japan sits at the end of a 30 day supply line from the Persian Gulf that has been essentially shutdown until the Donald’s war ends, meaning Tokyo is likely to hoard its own strategic reserves zealously.
And this gets us to the Donald’s real delusion: To wit, the false belief that “drill baby, drill” policies and surging US petroleum exports means that he can wait to settle the war as long as he pleases because the US economy is somehow insulated from the supply and price dislocations now roiling the global markets.
He’s dead wrong. When you track through the numbers carefully, as was done by Grok 4 in the table below, it becomes blatantly obvious that the only thing really going on is that the huge export shortfall from the Persian Gulf is resulting in nearly a barrel-for-barrel drain on US commercial and SPR stockpiles.
That’s right. Since February 28th there has been no increase in either crude oil production at about 13.6 million barrels/day (first column) nor total liquids production (second column). The latter includes natural gas liquids and refinery gains, where production is averaging about 21.2 million barrel per day.
At the same time, US exports have soared, as the Donald has been wont to point out. Combined exports of crude oil and products totaled 11.32 million barrels in February before any war impact and rerouting of tankers to the US Gulf Coast. But as of mid-May, the run rate of exports has hit 13.06 million barrels per day, representing a +1.74 million barrel per day gain in US petroleum exports.
So the question recurs. If production has not increased where did the surge in US exports come from?
Alas, the table below gives the answer: Whether he knows it or not, the Donald is draining the gas tank.
That is to say, 100% of the increase in exports has been derived from drawing down commercial stocks and the government SPR (Strategic Petroleum Reserve).
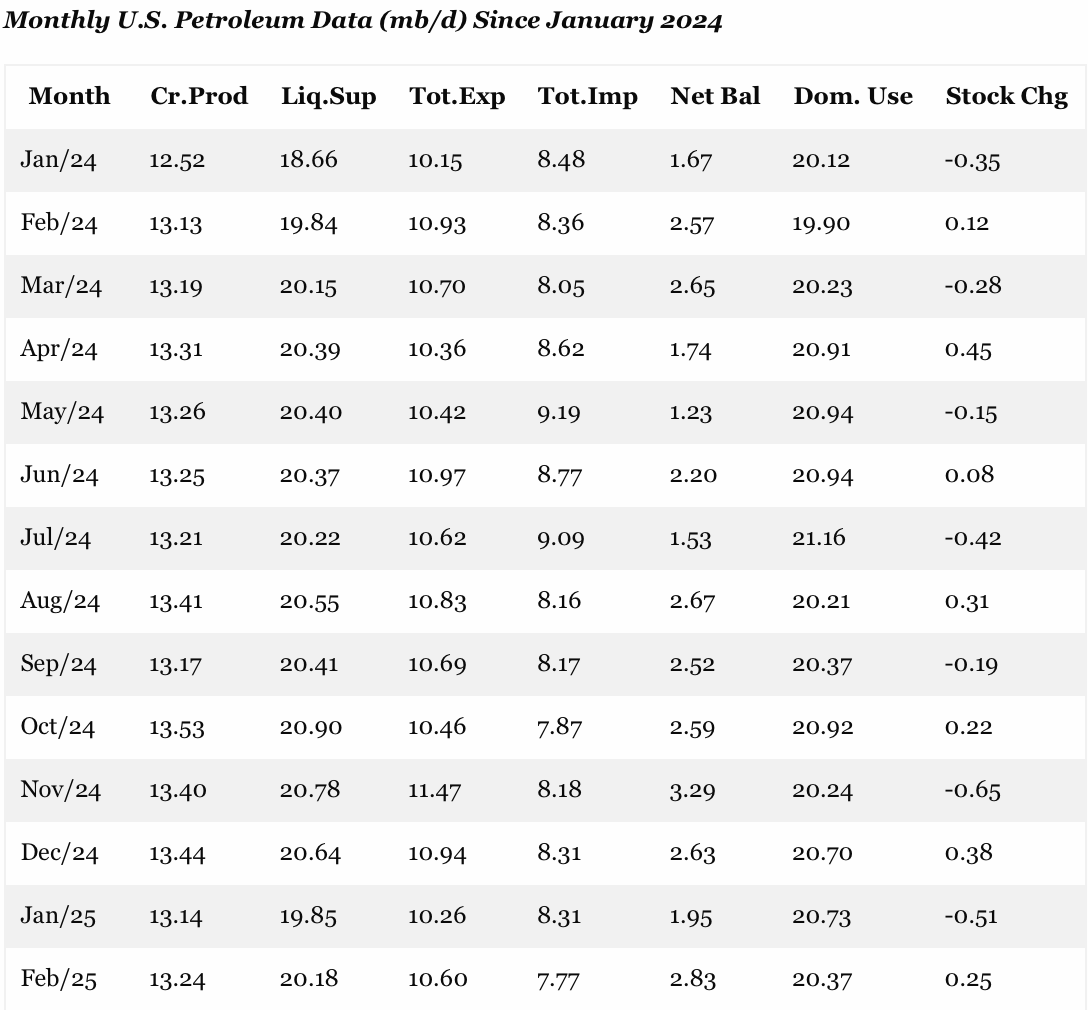
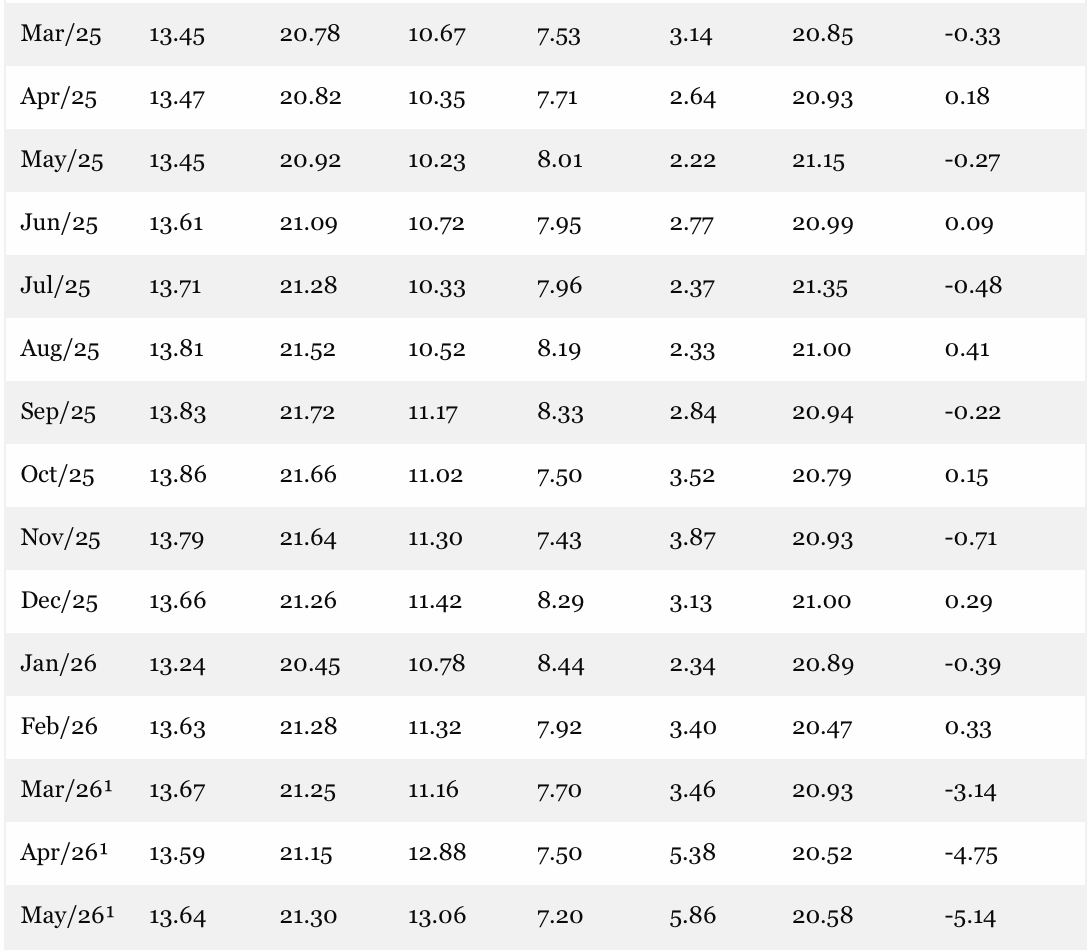
- Cr.Prod = Crude Oil Production
- Liq.Sup = Liquids Supply (Crude + NGPL)
- Tot.Exp = Total Exports (Crude + Products)
- Tot.Imp = Total Imports (Crude + Products)
- Net Bal = Net Exports (Exports – Imports)
- Dom. Use = Domestic Use / Product Supplied (apparent consumption) — stable ~20.5–21.4 mb/d
- Stock Chg = Total inventory change (commercial + SPR); large negative = big draw
For want of doubt, here are the before and after stock numbers for the USA. Between February 28 and May 15 upwards of 68 million barrels have been drawn down from the SPR and commercial stocks. That amounts to 1 million barrels per day for the period as a whole; and explains how the huge surge of exports during the last six weeks of April and May to date have been supplied.
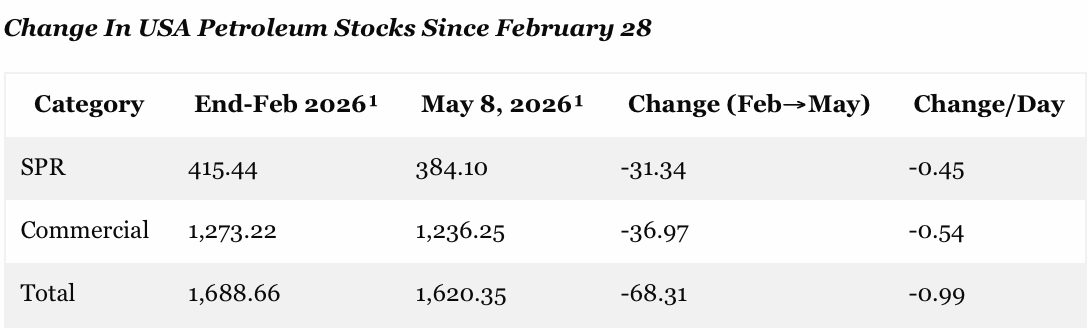
Notes:
- SPR: Crude oil only (Strategic Petroleum Reserve).
- Commercial: All commercial inventories (crude oil + petroleum products, excl. SPR).
- Total: SPR + Commercial.
- Large draws driven by record-high net exports in March–May 2026 while production and domestic use remained stable.
- Daily rates show consistent inventory pressure (~1 million barrels per day total draw on average).
In a word, if the Donald had someone around him competent (and brave) enough to explain to the POTUS that he is draining the US petroleum tank at an unsustainable rate, he might start reading the entirety of what Iran is putting on the table.
As it is, he is within a few months of thundering petroleum supply chain crash landing in both the global market, but also on main street America, as well. If that happens, a Dem sweep in the fall elections and the first ever impeachment and removal from office of a sitting president is on the table.
To use to the Donald’s favorite phrase, that will truly be like something you have never seen before.
David Stockman was a two-term Congressman from Michigan. He was also the Director of the Office of Management and Budget under President Ronald Reagan. After leaving the White House, Stockman had a 20-year career on Wall Street. He’s the author of three books, The Triumph of Politics: Why the Reagan Revolution Failed, The Great Deformation: The Corruption of Capitalism in America, TRUMPED! A Nation on the Brink of Ruin… And How to Bring It Back, and the recently released Great Money Bubble: Protect Yourself From The Coming Inflation Storm. He also is founder of David Stockman’s Contra Corner and David Stockman’s Bubble Finance Trader.